
Rental report shows growth in Perth and Brisbane
The CoreLogic Quarterly Rental Review shows national weekly rents increased by 0.3 per cent over the second quarter of 2019, led by increases in the Brisbane and Perth markets.
Sydney and Darwin were the only capital cities where rents declined across the June quarter, according to a new report.
CoreLogic's Quarterly Rental Review indicates capital city rents were 0.1 per cent higher over the quarter and -0.1 per cent lower year-on-year while the regional market rents were 0.7 per cent higher over the quarter to be 1.9 per cent higher over the past 12 months.
Brisbane and Perth were the only two capitals where the annual change in rents over the past year was superior to growth over the same period in 2018.
CoreLogic research analyst Cameron Kusher said the rental market remained quite mixed overall.
"It is clear that Sydney accounts for a large share of overall renters with annual falls in Sydney leading to a fall in the combined capital city index," he said.
“Sydney and Melbourne continue to experience the impact of heightened demand from investors over recent years along with a substantial ramp-up in new housing (largely apartment) supply, much of which was purchased by investors. “The past year has seen a change of direction for both the Brisbane and Perth rental markets, which are now climbing again following years of decline."
At the end of the 2018-19 financial year, national rents were recorded at $438/week.
Rental rates across the combined capital cities sat at $466/week and substantially higher than the $380/week across the combined regional markets.
Sydney remains the most expensive city to rent a property at $580/per week.
Mr Kusher said there had been a changing of the guard when it came to the most affordable city to rent.
"For many years Hobart has been the most affordable rental market," he said.
"However, the rapid growth in rents over recent years has seen it become more expensive than Brisbane, Adelaide, Perth and Darwin and on par with the cost of renting in Melbourne.”
Housing affordability marginally improved across the country in the March quarter 2019 with the exception of the Northern Territory, according to research from the Real Estate Institute of Australia and Adelaide Bank.
REIA President Adrian Kelly said the March quarter 2019 edition of the Adelaide Bank/REIA Housing Affordability Report found New South Wales had the largest improvement in housing affordability with a 1.3 per cent decrease in home loan repayments.
“While rental affordability improved marginally in the larger states of New South Wales, Victoria and Queensland as well as in Western Australia and the Northern Territory, a large decline in rental affordability in South Australia and Tasmania offset this improvement resulting in an overall decline in rental affordability nationally,” he said.
According to the report the total number of loans declined (excluding refinancing) decreased to 86,909, a decline of 20.0 per cent over the March quarter.
“This is not unusual for the first quarter of the calendar year, however, compared with the same quarter of 2018, the number of new loans declined by 13.7 per cent,” Mr Kelly said.
“The number of those entering the home loan market also declined over the year. Interestingly, while loan size decreased for changeover buyers, it increased marginally for first home buyers.”
Mr Kelly noted that the RBA’s decision yesterday to cut interest rates by 25 basis point rates will see a further improvement in affordability.
“Subject to the banks passing on the full cut, for a first home buyer this means a saving of $70 per month based on an average loan size of $338k in the March quarter of 2019," he said.
New South Wales
Over the March quarter, housing affordability in New South Wales improved with the proportion of income required to meet loan repayments decreasing to 35.4 per cent, a decrease of 1.3 percentage points over the quarter. Housing affordability also improved over the past year with proportion of income required to meet monthly loan repayments decreasing by 1.1 percentage points.
In New South Wales, the number of loans to first home buyers decreased to 5,790, a decrease of 24.2 per cent over the quarter and a decrease of 11.0 per cent compared to the March quarter 2018.
Rental affordability improved marginally in New South Wales over the March quarter with the proportion of income required to meet median rent payments decreasing to 28.2 per cent, a decrease of 0.1 percentage points over the March quarter and 1.9 percentage points compared with the March quarter 2018.
Victoria
Over the March quarter, housing affordability improved in Victoria with the proportion of income required to meet loan repayments decreasing to 32.5 per cent, a decrease of 0.6 percentage points over the quarter and 1.6 percentage points compared to the same quarter of the previous year.
The number of loans to first home buyers in Victoria decreased to 7,199, a decrease of 18.7 per cent over the quarter, and a decrease of 11.9% compared to the March quarter 2018. In Victoria, the total number of loans (excluding refinancing) decreased to 24,566, a decrease of 20.4 per cent during the quarter.
Rental affordability in Victoria improved over the March quarter with the proportion of income required to meet median rent decreasing marginally to 23.1 per cent, a decrease of 0.1 percentage points over the quarter and 0.7 percentage points compared with the March quarter 2018.
Queensland
Housing affordability in Queensland improved with the proportion of income required to meet loan repayments decreasing to 27.5%, a decrease of 0.6% over the quarter but remaining steady compared to the same quarter last year.
Over the March quarter, the number of loans to first home buyers in Queensland decreased to 4,677, a decrease of 17.4 per cent over the quarter and a decrease of 17.1 per cent compared to the same quarter of 2018. The number of loans (excluding refinancing) decreased in Queensland to 17,979, a decrease of 16.9 per cent over the quarter and a decrease of 14.9 per cent compared to the March quarter of the previous year.
Rental affordability in Queensland also improved over the quarter with the proportion of income required to meet the median rent decreasing to 22.0 per cent, a decrease of 0.1 percentage points over the quarter and a decrease of 1.1 percentage points over the past year.
South Australia
Over the March quarter, housing affordability in South Australia improved with the proportion of income required to meet monthly loan repayments decreasing to 26.9 per cent, a decrease of 0.6 percentage points over the quarter and 0.3 percentage points compared to the March quarter in 2018.
Over the March quarter, the number of loans to first home buyers in South Australia decreased to 1,370, a decrease of 16.7 per cent over the quarter but an increase of 5.6 per cent compared to the March quarter 2018. In South Australia, the total number of loans (excluding refinancing) decreased to 6,503, a decrease of 14.5% over the quarter, and a decrease of 2.0 per cent compared to the March quarter 2018.
Rental affordability in South Australia declined over the quarter with the proportion of income required to meet average rent payments increasing to 22.8 per cent, an increase of 0.8 percentage points over the quarter and an increase of 0.4 percentage points compared to the same quarter in 2018.
Western Australia
Over the March quarter, housing affordability in Western Australia improved with the proportion of income required to meet loan repayments decreasing to 22.6 per cent, a decrease of 0.5 percentage points over the quarter and a decrease of 1.0 percentage points over the previous year.
The number of first home buyers in Western Australia decreased to 3,313 in the March quarter, a decrease of 13.6 per cent over the quarter and a decrease of 7.4 per cent compared to the same time last year. The total number of loans (excluding refinancing) in Western Australia decreased to 9,235, a decrease of 16.2 per cent over the quarter and a decrease of 9.3 per cent compared to the same time last year.
Rental affordability in Western Australia also improved during the March quarter with the proportion of income required to meet the median rent decreasing to 16.5 per cent, a decrease of 0.1 percentage points over the quarter. However, rental affordability declined over the past year with the proportion of income required to meet median rent increasing 0.2 percentage points.
Tasmania
Over the March quarter, housing affordability in Tasmania improved with the proportion of income required to meet loan repayments decreasing to 25.4 per cent, a decrease of 0.9 percentage points over the quarter. However, housing affordability has declined over the past year with the proportion of income required to meet monthly loan repayments increasing by 0.9 percentage points.
The number of first home buyers in Tasmania decreased to 475, a decrease of 12.8 per cent over the quarter but an increase of 13.1 per cent compared to the same quarter of the previous year. The total number of new loans (excluding refinancing) in Tasmania decreased to 2,245, a decrease of 12.9 per cent
over the quarter but an increase of 4.5 per cent compared to the corresponding quarter 2018.
over the quarter but an increase of 4.5 per cent compared to the corresponding quarter 2018.
Rental affordability in Tasmania declined over the quarter with the proportion of income required to meet median rents increasing to 29.3 per cent, an increase of 1.2 percentage points over both the quarter and when compared to the same period in 2018.
Northern Territory
Over the March quarter, housing affordability in the Northern Territory declined with the proportion of income required to meet loan repayments increasing to 20.2 per cent, an increase of 0.8 percentage points over the quarter and an increase of 0.4 percentage points when compared to the March quarter 2018.
The number of loans to first home buyers in the Northern Territory decreased to 187, a decrease of 28.4% over the March quarter but an increase of 12.7% compared to the March quarter 2018. The number of new loans (excluding refinancing) in the Northern Territory decreased to 506, a decrease of 22.0 per cent over the quarter and a decrease of 17.6 per cent compared to the March quarter 2018.
Rental affordability in the Northern Territory improved during the March quarter with the proportion of income required to meet the median rent decreasing to 20.9 per cent, a decrease of 0.4 percentage points over the quarter and 1.6 percentage points over the previous year.
Australian Capital Territory
Over the March quarter, housing affordability in the Australian Capital Territory improved with the proportion of income required to meet loan repayments decreasing to 20.3 per cent, a decrease of 0.3 percentage points over the quarter.
The number of loans to first home buyers in the Australian Capital Territory decreased to 392, a decrease of 44.8 per cent over the quarter, and a decrease of 43.0 per cent compared to the March quarter 2018. The number of loans (excluding refinancing) in the Australian Capital Territory decreased to 1,952, a decrease of 31.0 per cent over the quarter and a decrease of 14.9 per cent compared to the March quarter 2018.
Rental affordability in the Australian Capital Territory has declined over the quarter with the proportion of income required to meet the median rent increasing to 19.0%, an increase of 0.1 percentage points over the quarter and an increase of 0.5 percentage points over the past year.
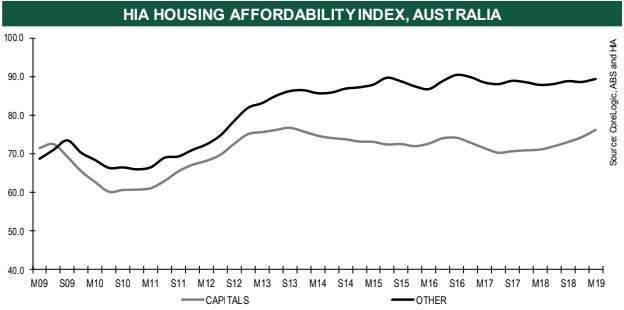
The sharpest rise in housing affordability since 2013 is a result of the "pent up" demand experienced in Sydney and Melbourne throughout the past two decades finally being met, according to the Housing Industry Association.
The HIA Affordability Index rose by 2.2 per cent in the March 2019 quarter to post the most significant improvement in affordability for nearly six years.
The index is calculated for each of the eight capital cities and regional areas on a quarterly basis and takes into account the latest dwelling prices, mortgage interest rates and wage developments.
At a glance:
- The HIA Affordability Index rose by 2.2 per cent in the March 2019 quarter, representing the sharpest increase since September, 2013.
- According to HIA, the improvement was most significant in the east coast cities.
- The boom in home building across the past five years is believed to have been a factor in the trend.
HIA Chief Economist Tim Reardon told WILLIAMS MEDIA the rise had come from the supply of new homes finally catching up with demand.
"We had 20 years of mismanagement when it came to the supply of new homes, which meant there weren't enough homes to satisfy demand, and house prices went up as a result," he said.
"Now we are seeing a sufficient number of homes being built to meet demand, meaning that new home building has declined significantly."
In its quarterly economic and industry outlook released last week, HIA's preliminary data suggested that the housing market has adjusted from a strong annualised rate of home building of around 220,000 homes per year this time last year, to around 183,000 at the start of 2019.
Mr Reardon said while the correction had occurred much quicker than they had anticipated, the historical context of the data had to be taken into account.
"What we've found is that consumers are very poor at picking the bottom of the housing price cycle," he said.
"We usually only know what the bottom was three to six months after we have been there.
"For home builders, the correction occurring in the market is quite painful, but from a national policy perspective, this is the sharpest downturn we have seen in 20 years to what will be the shallowest drop.
"It's been a sharp rate of decline, but we will probably end up where we were in 2012/13 which, at the time, were fairly reasonable years.
Source: HIA
Rapid east coast improvement
According to the HIA Affordability Index, improvement in housing affordability has been experienced across the country, with the exception only of Tasmania and the ACT, where ongoing house price growth has seen affordability remain static.
Mr Reardon was most significant in the east coast capital cities.
"Affordability in Sydney deteriorated to an extent that in June 2017 it required two average Sydney incomes to be able to afford repayments on an average Sydney home," he said.
"In just over a year this has improved to only requiring 1.8 standard incomes to purchase the same home.
“Similarly, in Melbourne, the Affordability Index has improved by almost 10 per cent in a year."
Five of the eight capital cities saw improved affordability over the year to March 2019. Sydney continues to be home to the greatest improvements, its index is up by 12.4 per cent.
This was followed by Melbourne (+9.6 per cent), Perth (+7.7 per cent), Darwin (+5.9 per cent) and Brisbane (+2.5 per cent). Affordability deteriorated in Hobart (-5.1 per cent), Canberra (-5.1 per cent) and Adelaide (-1.1 per cent).
Best Regards
Linda 姬琳达珍 and Carlos Debello (LREA)
LJ Gilland Real Estate Pty Ltd
No comments:
Post a Comment